Homes Built Before 1978 in Every Portland Neighborhood

About 61% of Portland's homes were built before 1978, the year lead based paint was banned. But that citywide number hides a huge range. This page breaks it down for 89 neighborhoods, from the streetcar era blocks of Laurelhurst and Alameda to the newest subdivisions in the West Hills, using U.S. Census data mapped to the City of Portland's official neighborhood boundaries.

 
25
neighborhoods where three quarters or more of homes were built before 1978
Laurelhurst
has the oldest housing in the city at 95% built before 1978
79%
of homes in Alameda date from before 1940, the highest share in Portland
Northwest Heights
has the newest housing at 5% built before 1978
 

Table: every neighborhood, ranked

Sort any column by clicking its heading, or filter by area of the city. The share built before 1970 is a floor that needs no estimating, and the share built before 1940 shows where lead paint and original wood siding are most likely.

Laurelhurst
Southeast
1,980
94.6%
93.3%
78.2%
Alameda
Northeast
2,433
89.0%
87.1%
78.6%
Rose City Park
Central Northeast
4,601
87.1%
84.8%
61.2%
Roseway
Central Northeast
3,066
86.7%
83.5%
40.3%
Parkrose Heights
East Portland
2,449
86.4%
76.1%
4.3%
Concordia
Northeast
4,394
86.0%
81.0%
47.7%
Beaumont-Wilshire
Central Northeast
2,570
85.8%
80.5%
53.9%
Irvington
Northeast
3,884
82.7%
77.3%
66.0%
Sabin
Northeast
2,189
82.5%
81.4%
65.5%
Grant Park
Central Northeast
2,032
82.4%
79.1%
68.0%
South Burlingame
Southwest
887
81.5%
74.5%
27.3%
Eastmoreland
Southeast
2,666
79.8%
70.2%
39.6%
University Park
North Portland
1,999
79.7%
75.0%
36.5%
Woodstock
Southeast
3,870
78.8%
73.2%
32.7%
Mt. Scott-Arleta
Southeast
3,482
78.5%
71.1%
42.5%
Ardenwald-Johnson Creek
Southeast
2,708
78.4%
66.3%
28.0%
Montavilla
Southeast
7,354
78.1%
68.8%
28.1%
Arbor Lodge
North Portland
3,315
77.8%
74.7%
51.3%
Vernon
Northeast
1,181
77.8%
74.4%
52.1%
Parkrose
East Portland
2,404
77.3%
68.3%
15.4%
Mt. Tabor
Southeast
5,117
77.1%
71.5%
41.4%
Piedmont
North Portland
3,563
76.8%
68.9%
47.0%
Madison South
Central Northeast
3,731
75.8%
71.2%
20.1%
Sumner
Central Northeast
914
75.1%
71.4%
26.7%
Woodlawn
Northeast
2,553
75.1%
71.1%
42.2%
South Tabor
Southeast
3,159
74.5%
66.8%
21.8%
Richmond
Southeast
6,390
74.4%
70.9%
49.5%
North Tabor
Southeast
2,778
74.1%
68.8%
28.9%
Bridlemile
Southwest
2,513
73.7%
54.5%
4.8%
Hosford-Abernethy
Southeast
4,504
73.5%
70.6%
56.7%
Foster-Powell
Southeast
3,582
71.9%
62.1%
29.4%
Sunnyside
Southeast
3,899
71.3%
65.3%
52.4%
Hillsdale
Southwest
3,642
71.1%
60.4%
11.8%
Homestead
Southwest
1,209
70.1%
63.1%
25.0%
Sullivan's Gulch
Northeast
1,963
69.3%
59.3%
42.6%
Creston-Kenilworth
Southeast
4,272
69.1%
55.1%
30.2%
Markham
Southwest
815
68.7%
56.4%
17.2%
Humboldt
Northeast
2,419
68.6%
66.5%
49.9%
Hollywood
Central Northeast
1,290
67.9%
65.2%
35.9%
Overlook
North Portland
3,899
67.7%
64.9%
43.7%
Brooklyn
Southeast
3,527
67.5%
62.5%
42.4%
Reed
Southeast
1,738
67.2%
43.3%
19.0%
Argay Terrace
East Portland
2,658
67.0%
43.3%
0.7%
Hillside
Northwest
750
66.2%
63.7%
39.6%
Kenton
North Portland
3,761
66.0%
60.1%
36.2%
King
Northeast
3,228
66.0%
63.7%
49.4%
Southwest Hills
Northwest
4,609
65.8%
57.3%
24.5%
Cully
Central Northeast
5,871
65.2%
56.7%
16.2%
Hayhurst
Southwest
2,617
64.9%
46.4%
6.4%
Sellwood-Moreland
Southeast
5,380
64.9%
57.0%
38.4%
Portsmouth
North Portland
4,186
64.5%
58.0%
24.3%
Arlington Heights
Northwest
1,205
64.1%
62.0%
37.1%
Brentwood-Darlington
Southeast
5,227
63.9%
56.2%
20.0%
Collins View
Southwest
472
62.6%
55.1%
18.3%
Centennial
East Portland
8,923
62.4%
44.9%
2.4%
Sylvan-Highlands
Northwest
1,161
62.1%
56.7%
25.2%
Glenfair
East Portland
1,216
60.4%
37.2%
2.0%
Maplewood
Southwest
1,351
60.1%
39.4%
10.5%
Northwest District
Northwest
12,569
59.8%
55.8%
38.5%
Buckman
Southeast
6,599
59.2%
53.0%
38.7%
Cathedral Park
North Portland
2,564
57.8%
50.4%
26.9%
Kerns
Southeast
5,099
56.7%
48.1%
35.2%
Linnton
Northwest
550
56.7%
54.1%
37.0%
Hazelwood
East Portland
10,635
56.5%
46.0%
3.5%
Multnomah
Southwest
4,475
56.2%
42.0%
12.7%
Mill Park
East Portland
3,891
55.9%
41.5%
3.6%
Lents
East Portland
8,614
54.9%
42.4%
16.8%
Ashcreek-Crestwood
Southwest
2,913
54.6%
36.6%
5.5%
Marshall Park
Southwest
580
54.4%
38.2%
5.3%
Powellhurst-Gilbert
East Portland
10,424
53.9%
41.8%
5.8%
St. Johns
North Portland
6,160
53.6%
46.8%
21.6%
Russell
East Portland
1,693
52.5%
47.7%
0.3%
Arnold Creek
Southwest
1,259
52.1%
33.8%
2.3%
Goose Hollow
Northwest
5,292
52.0%
43.1%
22.5%
Wilkes
East Portland
3,996
49.6%
33.5%
0.8%
Hayden Island
North Portland
880
48.0%
21.7%
5.1%
West Portland Park
Southwest
1,850
47.4%
15.0%
5.5%
Old Town
Northwest
2,200
44.0%
36.7%
27.5%
Forest Park
Northwest
1,657
40.3%
35.5%
15.4%
Boise
Northeast
3,010
38.4%
36.5%
29.9%
Lloyd
Northeast
2,442
37.9%
30.7%
17.5%
Portland Downtown
Northwest
9,849
37.3%
31.4%
19.5%
Far Southwest
Southwest
1,031
35.8%
14.1%
3.3%
Eliot
Northeast
3,709
31.6%
28.2%
21.8%
Pleasant Valley
East Portland
6,423
28.0%
17.0%
3.6%
South Portland
Southwest
6,301
22.4%
20.1%
12.8%
East Columbia
North Portland
328
21.2%
15.7%
2.1%
Pearl District
Northwest
8,294
8.6%
7.9%
6.2%
Northwest Heights
Northwest
2,312
5.2%
4.0%
0.2%

Sources: U.S. Census Bureau, American Community Survey 2020 to 2024 five year estimates, table B25034, Year Structure Built, by census tract, retrieved September 2026 via Census Reporter; tract boundaries from the Census Bureau TIGERweb service; Neighborhood Boundaries from PortlandMaps Open Data, City of Portland. Tract counts were allocated to neighborhoods in proportion to overlapping land area. "Built before 1978" counts all homes built before 1970 plus eight tenths of homes built between 1970 and 1979. Housing unit figures are rounded estimates and carry survey margins of error, which are wider for small neighborhoods. Neighborhoods under 150 estimated units are omitted.

What the pattern shows

The oldest housing forms a band through inner Northeast and Southeast: Laurelhurst, Alameda, Irvington, Sabin, Grant Park, Rose City Park and Eastmoreland were largely built out before the Second World War, and in several of them two thirds or more of homes are from before 1940. These are the neighborhoods where original wood siding, single pane wood windows, knob and tube wiring and lead based paint are most likely to show up on the same house.

East Portland tells a different story. Parkrose Heights, Roseway, Madison South and Montavilla have high pre 1978 shares but very little from before 1940. This is postwar housing from the 1950s and 1960s, often with original hardboard or early composite siding that has reached the end of its service life, and 1960s aluminum windows. The lead paint rule still applies, and the moisture damage behind older siding is usually more advanced than owners expect.

At the other end, the Pearl District, South Portland, Northwest Heights and Pleasant Valley are mostly post 1990 construction where lead safe work practices are rarely triggered but where builder grade windows and early generation composite siding are now reaching replacement age.

What this means for a renovation

Any project that disturbs painted surfaces in a pre 1978 home falls under the EPA Renovation, Repair and Painting Rule, which covers siding replacement, window replacement, dry rot repair, exterior painting and most interior work. The contractor must hold EPA Lead Safe certification, set up containment, follow lead safe work practices, clean and verify the area, and give you written documentation. In Oregon the contractor also needs a Lead Based Paint Renovation license from the CCB. Ask for both before work starts.

Serving Portland Metro Area

VResh Construction provides window replacement, siding installation, roofing, dry rot repair and full exterior renovation services throughout the Portland metro area and Southwest Washington.

Portland Metro — Oregon

Southwest Washington

Extended Service Areas
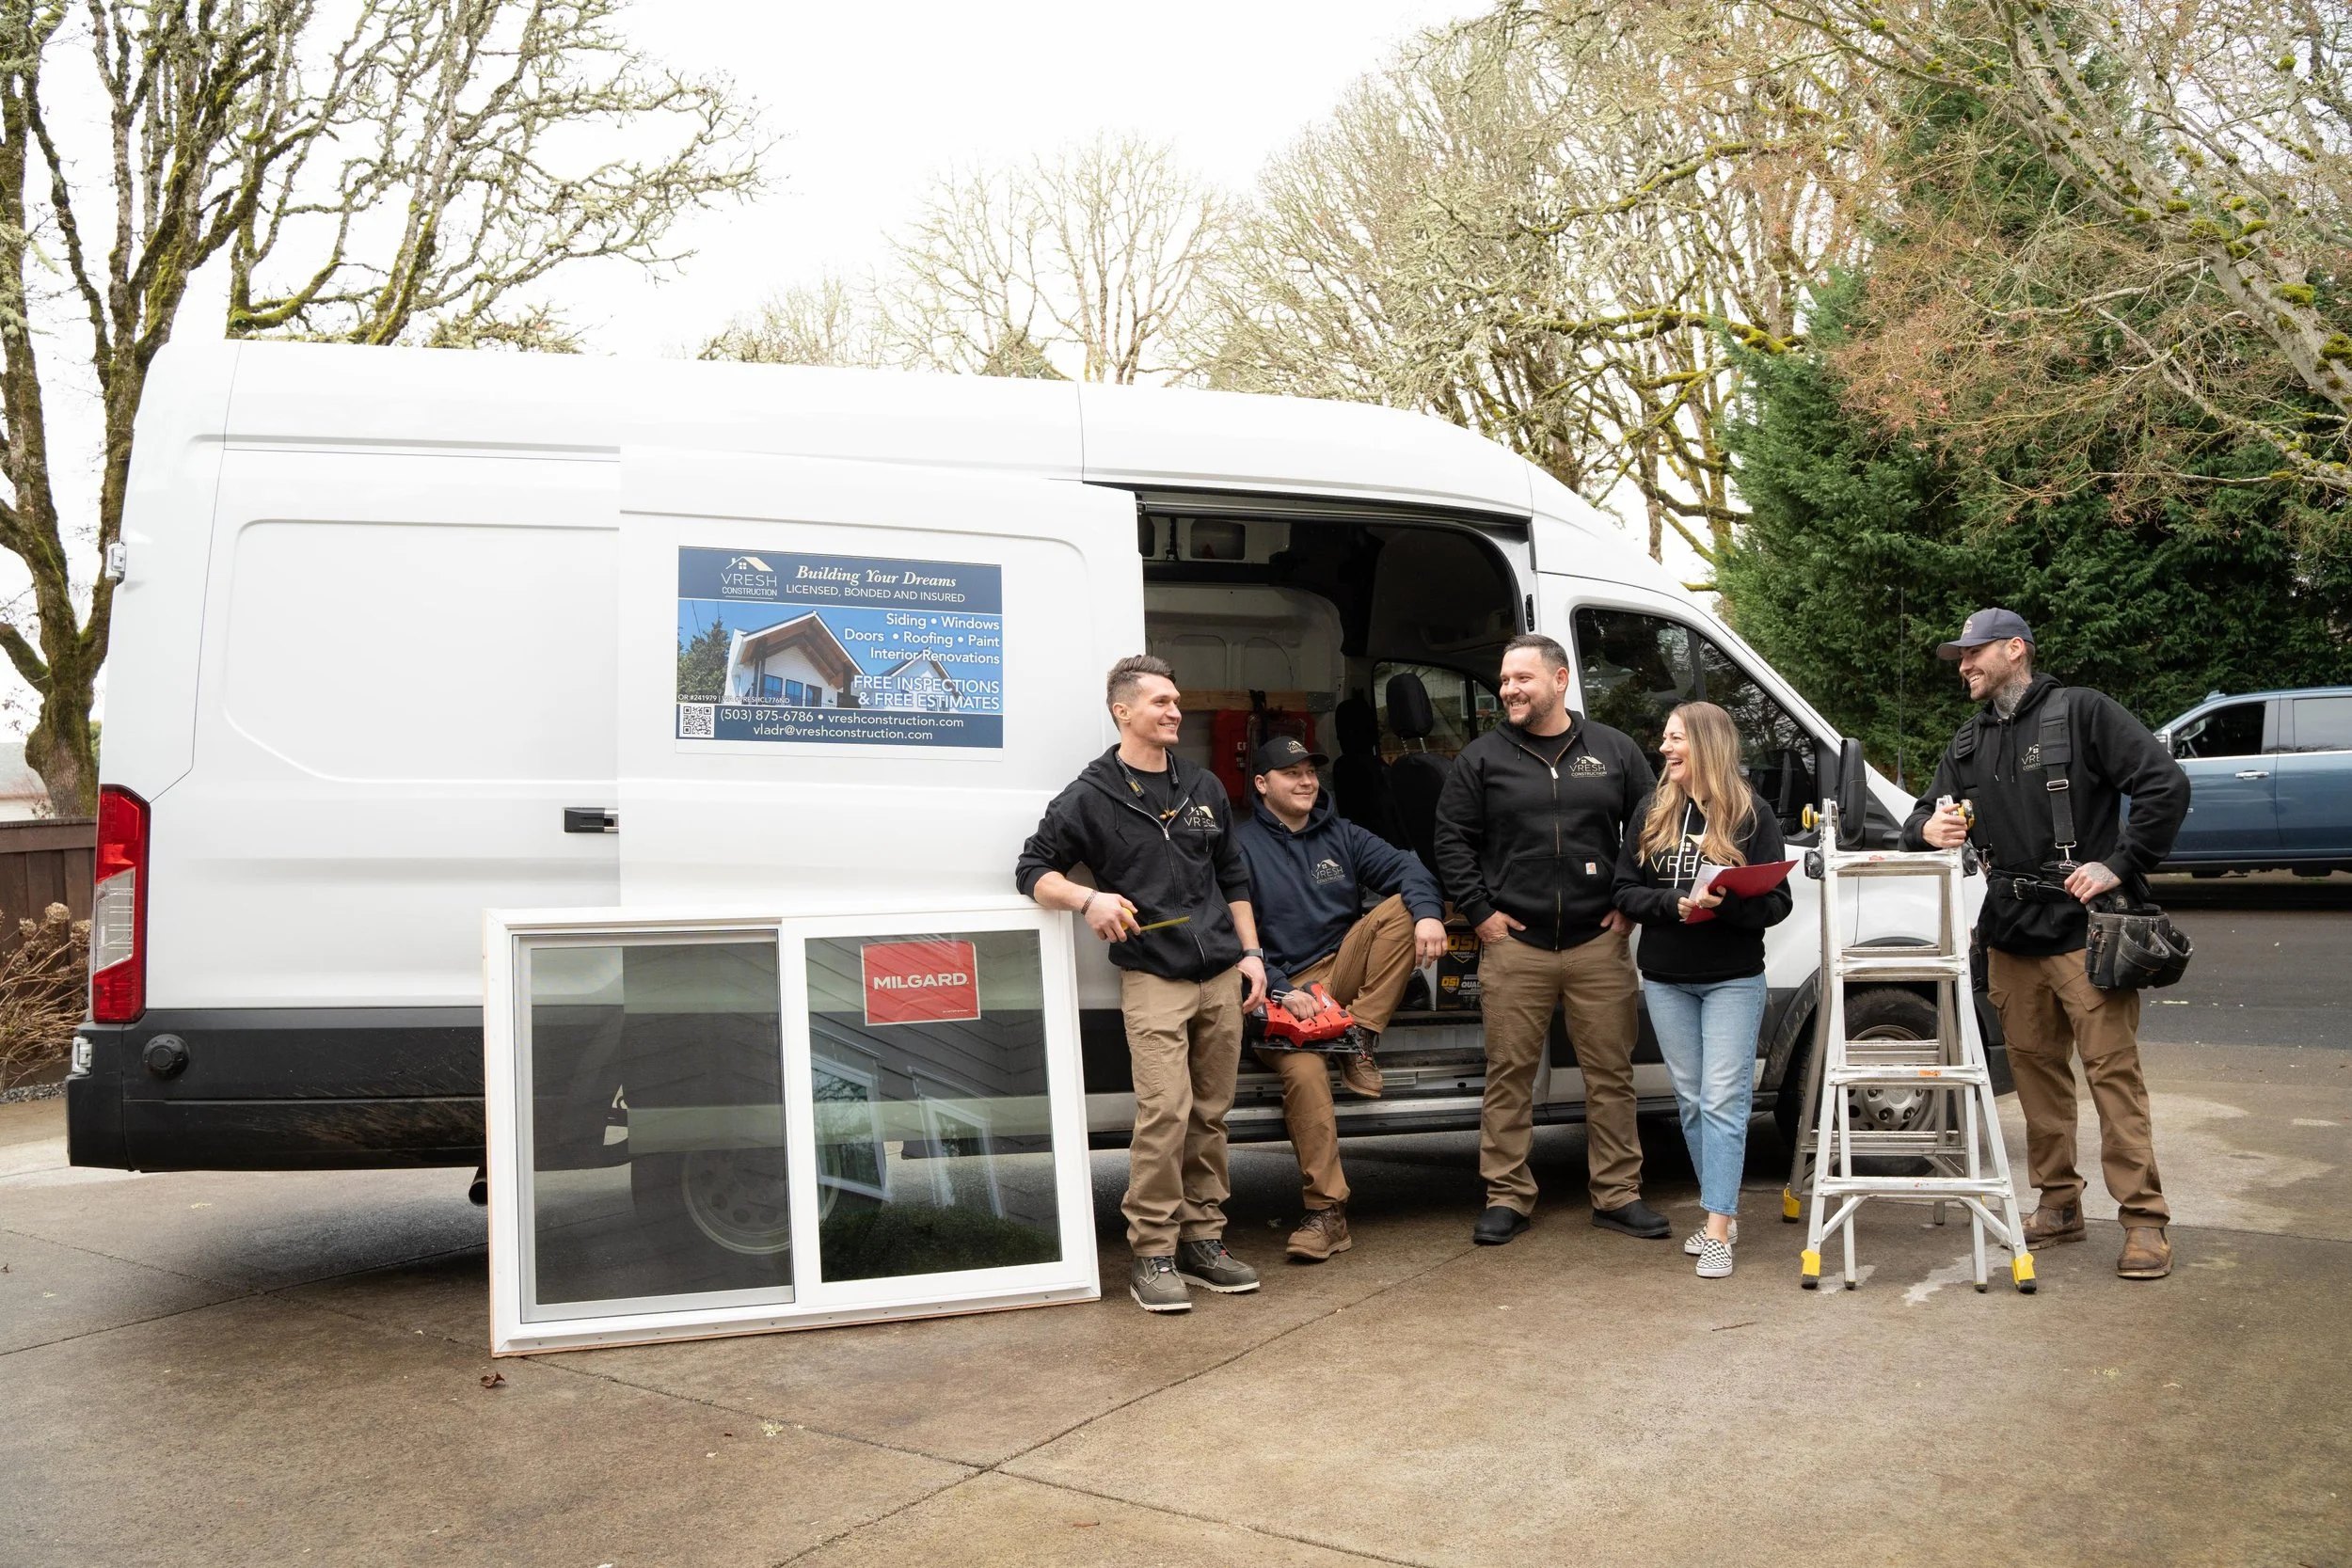
Group of five people standing and sitting next to a white service van with a sign on the side, one person holding a spirit level, another with a clipboard, and one with a tool belt, outdoors in parking lot with leafless trees in the background.

(503) 272-6436 — Call or Text, Available 24/7

We answer calls and texts at any hour. For storm damage, active leaks, or structural emergencies, calling directly is the fastest path to a response.

OUR FAQS

Questions about this data

Why does 1978 matter?
+
Lead based paint was banned for residential use in the United States in 1978. Under the EPA Renovation, Repair and Painting Rule, any contractor who disturbs painted surfaces in a home built before 1978 must hold EPA Lead Safe certification and follow containment, cleaning and documentation procedures. Oregon adds a state Lead Based Paint Renovation license requirement through the CCB.
How were neighborhood figures calculated when the Census does not report by neighborhood?
+
The Census Bureau reports Year Structure Built by census tract. Tract boundaries do not follow neighborhood boundaries, so each tract's housing counts were divided among the neighborhoods it overlaps in proportion to land area, using the City of Portland's official neighborhood boundary file. This is a standard method called areal interpolation. It is accurate for neighborhoods where housing is spread evenly and less precise where a tract mixes dense and empty land.
What about areas shared between two neighborhoods?
+
Portland has about 25 small areas that two neighborhood associations both claim, such as the strip between Alameda and Irvington. Those areas are counted in both neighborhoods' totals, because each association treats the area as its own. The map shows them as separate outlined pieces.
Why are some neighborhoods missing?
+
Neighborhoods with fewer than 150 estimated housing units, along with the unincorporated pockets of Multnomah County inside city limits, are left out because the estimates are too small to be reliable. Industrial and port areas fall into this group.
Does a home built before 1978 always contain lead paint?
+
No. The likelihood rises with age: roughly one in four homes built between 1960 and 1977, about seven in ten built between 1940 and 1959, and close to nine in ten built before 1940, according to HUD and EPA estimates. A lead paint test is the only way to know for certain.
Can I use this data?
+
Yes. It is derived from public Census Bureau and City of Portland data. You are welcome to cite it, embed the figures or link to this page, and a CSV download is provided under the table.
Close-up of large gold quotation marks on a black background

Client's Talk

We have a wealth of experience working as main building contractors on all kinds of projects, big and small, from home maintenance and improvements to extensions, refurbishments and new builds.

Own an older Portland home?

VResh Construction is EPA Lead Safe Certified and licensed in Oregon (CCB #241979). We handle siding, windows, roofing, dry rot repair and interior renovation on pre 1978 homes across every neighborhood on this map, with full RRP compliance and written documentation.